

The State of State Legislatures
State legislatures, as institutions, have incredible influence over our democracy and economy. State lawmakers, as individuals, also wield considerable power in the decisions that affect all of our lives. But all too often, state legislatures are significantly underresourced and inaccessible to the public. Similarly, the job of running for and serving as a state legislator demands wealth, time, and access to power that most people—especially historically marginalized communities—lack.
There are unique rules and structures in place in each state legislature that determine how each of the nation’s 7,383 state lawmakers can govern on behalf of the people they represent. Altogether, these unique institutional features, like legislator salary, staffing size, and session length, can deeply impact who can serve as a state legislator and who is prioritized in key policy decisions.
Editor’s Note: This publication was written prior to the 2022 midterm elections, which resulted in some notable gains for representation in state legislatures. All across the country, states celebrated historic wins for Latinx, LGTBTQ+, and Muslim state lawmakers, while Colorado joined Nevada to become the second state to have a majority-woman legislature in the nation.
The demographic data reported in this publication predates the results of the 2022 election. Due to the limited availability of demographic data on state legislators, this publication reports data largely collected between 2020-2022:
- Race and ethnicity (2020)
- Gender, race, and ethnicity (2022)
- LGBTQ+ identity (2022)
- New American status (2020)
- Generation (2020)
- Educational attainment (2020)
See our Methodology Appendix for more information and a full list of sources.
Methodology
The data shared in this publication provides insights into two key questions:
- How well resourced and productive are state legislatures as policymaking institutions?
- How do state legislatures compare with their state populations?
To answer these questions, this publication aggregates several datasets on state legislatures and state legislator demographics to provide the most comprehensive view of state legislatures across the country based on available data. The primary sources of data reported in this publication are from:
-
National Conference of State Legislatures (NCSL) – institutional information, legislators by race and ethnicity, legislators by generation, legislators by educational attainment
-
Center for American Women and Politics (CAWP) – women legislators, women in legislative leadership, women legislators by race and ethnicity
-
Victory Institute – LGBTQ+ legislators
-
New American Leaders – New American (first- and second-generation immigrant) legislators
We compare the institutional characteristics – staffing levels, legislator compensation, bills introduced and enacted – across the 50 states. To better understand this data, we compare similar state legislatures based on a categorization developed by NCSL to assess “the capacity of legislatures to function as independent branches of government, capable of balancing the power of the executive branch and having the information necessary to make independent, informed policy decisions.” The NCSL categories are based on the amount of time that legislators spend doing their jobs, legislator compensation, and legislative staffing levels:
-
Full-time legislatures generally require 80% or more of a full-time job, are well-paid, and have large staff sizes. Full-time lite legislatures spend slightly less time in session, have smaller districts, lower pay, and fewer staff than full-time legislatures.
-
Part-time legislatures, also known as traditional or citizen legislatures, spend the equivalent of half of a full-time job doing legislative work, receive low pay that requires other sources of income, and have small staff. Part-time lite legislatures are slightly less traditional than part-time legislatures.
-
Hybrid legislatures are somewhere between a full- and part-time legislature, requiring more than two-thirds of a full-time job, being paid more than a part-time legislature but still requiring another source of income, and having intermediate-sized staff.
We developed a representation ratio (RR) to approximate the extent to which a certain demographic group is underrepresented or overrepresented within a state legislature based on the state population. The resulting ratio compares the share of a demographic group within a legislature with their share within the state’s adult population to reflect the universe of people within a state who would be eligible to serve (legislative candidates must be at least 18 years old in almost every state, with some states limiting eligibility for the upper chamber to those 30 years and older). For example, the RR for Black women in the Alabama Legislature is calculated as follows:
|
Black Women in the Alabama Legislature |
÷ |
Total number of Alabama legislators |
= |
RR for Black women in Alabama |
|
Total number of Alabama legislators |
Total number of Alabama legislators |
The representation ratio is an estimation of how underrepresented or overrepresented a particular demographic group is based on their share of the overall adult population in each state:
-
Equal representation. An RR of 1.0 means that a group has the same level of representation in the state legislature as in the state’s adult population.
-
Overrepresentation. An RR of greater than 1.0 means that a group has more representation in the state legislature than in the state’s adult population.
-
Underrepresentation. An RR of less than 1.0 means that a group has less representation in the state legislature than in the state’s adult population.
Key Findings
How well resourced and productive are state legislatures as policymaking institutions?
The vast majority of state legislators are paid less than the median household income in their states. The average annual salary for legislators was $34,074, or just 50% of the average state median household income across all 50 states. Legislators in 45 states, or 88.3% of all state legislators, receive an annual salary that is less than the state median household income. Part-time legislators receive the lowest salary of any group.
-
The average full-time legislator received an annual salary of $76,253, which was 6.6% higher than the average state median household income ($72,250).
-
The average hybrid legislator received an annual salary of $29,978, which was just 44.8% of the average state median household income ($67,271).
-
The average part-time legislator received an annual salary of $11,553, which was just 18.8% of the average state median household income ($65,998).
The average member of Congress has eight times as many staff as the average state legislator. On average, there are 36.7 staff per member of Congress, compared to 4.4 staff per state legislator. Part-time legislators have the fewest number of staff of any group.
-
The average full-time legislature has 1,198 permanent and session staff, or 7.9 staff per legislator.
-
The average hybrid legislature has 622 permanent and session staff, or 4.6 staff per legislator.
-
The average part-time legislature has 230 permanent and session staff, or 1.7 staff per legislator.
Despite low pay and having significantly fewer staff than Congress, state legislatures are incredibly effective as policymaking institutions. In the 2021 session, the average state legislature introduced 3,036 bills and enacted 644 of them, or 28.8%. By contrast, the 116th Congress introduced 16,601 bills and enacted 1,229 of them, or 7.4%. Though the average part-time legislature enacted the largest share of bills introduced, they also introduced significantly fewer bills than full-time and hybrid legislatures.
-
The average full-time legislature introduced 5,373 bills and enacted 517 of them, or 11.8%.
-
The average hybrid legislature introduced 3,002 bills and enacted 819 of them, or 32.4%.
-
The average part-time legislature introduced 1,432 bills and enacted 410 of them, or 34.1%.
When measuring legislative effectiveness as the number of bills enacted per legislator, state legislatures in 41 states enacted more bills per legislator than the most recent Congress. While the average member of the 116th Congress enacted 2.3 bills, the average state legislator enacted twice as many bills, or 4.7 bills per legislator. Hybrid legislatures enacted the most bills per legislator of any group.
-
The average full-time legislator enacted 3.3 bills.
-
The average hybrid legislator enacted 6.1 bills.
-
The average part-time legislator enacted 3.1 bills.
How do state legislatures compare with their state population?
Race and Ethnicity
Black, Indigenous, and other people of color are underrepresented in the average state legislature and across all types of legislatures. Despite being underrepresented overall, Black, Indigenous, and other people of color have higher levels of representation in well-resourced legislatures than in underresourced legislatures. Nearly 8 in 10 state lawmakers are white, and white lawmakers have similar levels of overrepresentation across full-time, hybrid, and part-time legislatures.
-
” The most underrepresented racial or ethnic group in state legislatures...” Asian and Pacific Islanders are the most underrepresented racial or ethnic group in state legislatures across the country, followed by Latinx, Multiracial, Indigenous, and Black legislators.Click for more ▶ Share:
Asian and Pacific Islander legislators represent only 1.5% of state legislators across the country and have an average representation ratio of 0.20 nationally. API legislators have the highest levels of representation in full-time legislatures (RR=0.39) and lower levels of representation in hybrid (RR=0.14) and part-time (RR=0.16) legislatures. API legislators are underrepresented in every state except for Hawaii, and 27 states reported having no API legislators.
-
Black legislators represent only 9.5% of state legislators across the country and have an average representation ratio of 0.83 nationally. Black legislators have the highest levels of representation in full-time legislatures (RR=0.97) and lower levels of representation in hybrid (RR=0.79) and part-time (RR=0.82) legislatures. Black legislators are underrepresented in all but 13 states (Alaska, Colorado, California, Florida, Idaho, Illinois, Montana, Nevada, New Jersey, New Mexico, New York, Ohio, and South Carolina), and four states reported having no Black legislators (Iowa, Minnesota, Oregon, and North Dakota).
-
Indigenous legislators represent only 0.7% of state legislators across the country and have an average representation ratio of 0.75 nationally. Indigenous legislators have more than equal representation in full-time legislatures (RR=1.05) and are underrepresented in hybrid (RR=0.61) and part-time legislatures (0.79). Indigenous legislators are underrepresented in all but nine states (Arizona, California, Kansas, Maine, Maryland, Massachusetts, Mississippi, Montana, and Vermont), and 31 states reported having no Indigenous legislators.
-
Latinx legislators represent only 4.4% of state legislators across the country and have an average representation ratio of 0.34 nationally. Latinx legislators have the highest levels of representation in full-time legislatures (RR=0.53) and lower levels of representation in hybrid (RR=0.31) and part-time (RR=0.26) legislatures. Latinx legislators are underrepresented in every state except for Michigan and Minnesota, and 10 states reported having no Latinx legislators.
-
Multiracial legislators represent only 0.9% of state legislators across the country and have an average representation ratio of 0.50 nationally. Multiracial legislators have more than equal representation in full-time legislatures (RR=1.11) and are underrepresented in hybrid (RR=0.40) and part-time (RR=0.72) legislatures. Multiracial legislators are underrepresented in all but seven states (California, Illinois, New Jersey, New York, Ohio, Rhode Island, and Virginia), and 27 states reported having no multiracial legislators.
-
White legislators represent 79.4% of state legislators across the country and are overrepresented by 14% nationally (RR=1.14). White legislators have similar levels of overrepresentation across full-time (RR=1.15), hybrid (RR=1.17), and part-time (RR=1.06) legislatures. White legislators are overrepresented in all but six states (Hawaii, Mississippi, Nebraska, New Hampshire, Utah, and West Virginia), though not by a significant margin compared to legislators of color.
Gender, Race, and Ethnicity
Women are underrepresented in every state legislature except for Nevada. Women represent only 31.1% of all state legislators, with an average representation ratio of 0.62 nationally. Additionally, 25.1% of leadership positions are held by women, with an average representation ratio of 0.48 nationally.
-
Women have similar levels of underrepresentation across full-time (RR=0.65), hybrid (RR=0.61), and part-time (RR=0.60) legislatures.
-
When it comes to serving in positions of leadership, women have the highest levels of representation in full-time legislatures (RR=0.56) and lower levels of representation in hybrid (RR=0.50) and part-time (RR=0.40) legislatures. Women are underrepresented in positions of leadership in every state except for in Virginia, and there are no women in positions of leadership in seven states (Alaska, Iowa, Missouri, New Hampshire, South Carolina, South Dakota, and Texas).
Asian and Pacific Islander, Latina, and Indigenous women are underrepresented at higher rates than women overall in state legislatures. Despite being underrepresented overall, Asian and Pacific Islander women and Latinas have higher levels of representation in well-resourced legislatures than in underresourced legislatures, while Indigenous women have higher levels of representation in underresourced legislatures. White women have higher levels of representation than women overall in state legislatures.
-
Asian and Pacific Islander women represent only 1.0% of state legislators across the country and have an average representation ratio of 0.36 nationally. API women have the highest levels of representation in full-time legislatures (RR=0.45) and lower levels of representation in hybrid (RR=0.32) and part-time legislatures (RR=0.39). API women are underrepresented in all but three states (Hawaii, Nebraska, and Washington), and 22 states reported having no API women legislators.
-
Black women represent only 5.0% of state legislators across the country and are close to having equal representation nationally, with an average representation ratio of 0.99. Black women have roughly equal representation in hybrid legislatures (RR=1.02) and are slightly underrepresented in full-time (RR=0.97) and part-time (RR=0.93) legislatures. Black women are underrepresented in all but 21 states (Alaska, California, Colorado, Delaware, Florida, Georgia, Illinois, Maryland, Michigan, Nevada, New Hampshire, New Jersey, New Mexico, New York, Ohio, Oregon, Rhode Island, Utah, Washington, Wisconsin, and Wyoming), and eight states reported having no Black women legislators (Arizona, Hawaii, Idaho, Montana, Nebraska, North Dakota, South Dakota, and Vermont). A previous report published by SiX with the National Organization of Black Elected Legislative Women (NOBEL Women), “No Democracy Without Black Women,” provides some additional insight into the important role that Black women legislators play in delivering lasting progressive change through policymaking.
-
Indigenous women represent only 0.4% of state legislators across the country and have an average representation ratio of 0.51 nationally. Indigenous women have the highest levels of representation in part-time legislatures (RR=0.83) and lower levels of representation in hybrid legislatures (RR=0.52). Unlike other demographic groups that typically enjoy higher levels of representation in well-resourced legislatures, Indigenous women are severely underrepresented in full-time legislatures, with a representation ratio of 0.02. Indigenous women are underrepresented in all but nine states (Arizona, Arkansas, Kansas, Minnesota, Mississippi, Missouri, Oregon, Washington, and Wyoming), and 35 states reported having no Indigenous women legislators.
-
” The most underrepresented women in state legislatures across the country...” Latinas are the most underrepresented women in state legislatures across the country, followed by Asian and Pacific Islander, white, Indigenous, and Black women legislators.Click for more ▶ Share:
Latinas represent only 2.1% of state legislators across the country and have an average representation ratio of 0.30 nationally. Latinas have the highest levels of representation in full-time legislatures (RR=0.42) and lower levels of representation in hybrid (RR=0.28) and part-time (RR=0.24) legislatures. Latinas are underrepresented in every state except for West Virginia and Wisconsin, and 20 states reported having no Latina legislators.
-
Middle Eastern and North African women represent only 0.1% of state legislators across the country. There is no available state population data to estimate their representation in state legislatures compared to the adult population.
-
White women represent 22.8% of state legislators across the country and have an average representation ratio of 0.65 nationally. White women have the highest levels of representation in full-time legislatures (RR=0.71) and lower levels of representation in hybrid (RR=0.63) and part-time (RR=0.61) legislatures. White women are underrepresented in all but four states (Arizona, Hawaii, Nevada, and New Mexico), and no states reported having no white women legislators.
LGBTQ+
LGBTQ+ legislators are underrepresented in the average state legislature and across all types of legislatures. LGBTQ+ legislators have the highest levels of representation in underresourced legislatures.
-
LGBTQ+ legislators represent 2.7% of state legislators across the country and have an average representation ratio of 0.63 nationally. LGBTQ+ legislators have the highest levels of representation in part-time legislatures (RR=0.67) and lower levels of representation in full-time (RR=0.53) and hybrid (RR=0.64) legislatures. LGBTQ+ legislators are underrepresented in all but nine states (California, Colorado, Delaware, Nevada, Oregon, Rhode Island, Vermont, Washington, and Wyoming), and no legislators self-identified as LGBTQ+ in four states (Alaska, Louisiana, Mississippi, and South Dakota).
New Americans
New American legislators, or first- and second-generation immigrants, are underrepresented in the average state legislature and across all types of legislatures. New Americans have the highest levels of representation in well-resourced legislatures.
-
New Americans represent just 3.5% of state legislators and have an average representation ratio of 0.47 nationally. New Americans have the highest levels of representation in full-time legislatures (RR=0.70) and lower levels of representation in hybrid (RR=0.49) and part-time (RR=0.26) legislatures. New Americans are underrepresented in all but four states (Arizona, California, Michigan, and Ohio), and 10 states reported having no New American legislators.
Generation
Millennials are the most underrepresented age group in state legislatures, while Baby Boomers are overrepresented in over half of all state legislatures. Millennial and Generation X legislators are underrepresented overall but have higher levels of representation in well-resourced legislatures.
-
Millennials represent just 5.5% of state legislators and have an average representation ratio of 0.27 nationally. Millennials have the highest level of representation in full-time legislatures (RR=0.35) and lower levels of representation in hybrid (RR=0.28) and part-time (RR=0.19) legislatures. Millennials are underrepresented in every state legislature in the country.
-
Generation X legislators represent 14.9% of state legislators across the country and have an average representation ratio of 0.76 nationally. Gen X legislators are close to having equal representation in full-time legislatures (RR=0.92) and have lower levels of representation in hybrid (RR=0.82) and part-time (RR=0.54) legislatures. Gen X legislators are underrepresented in all but 15 states (California, Florida, Kentucky, Louisiana, Maryland, Michigan, Minnesota, Mississippi, Nevada, New Jersey, Rhode Island, South Carolina, Texas, Virginia, and Wisconsin).
-
Baby Boomers represent 26.5% of state legislators across the country and have an average representation ratio of 1.23 nationally. Baby Boomers are overrepresented in full-time (RR=1.20), hybrid (RR=1.27), and part-time (RR=1.17) legislatures, and are overrepresented in 28 states.
-
Silent Generation legislators represent 4.6% of state legislators across the country and have an average representation ratio of 0.63 nationally. Silent Generation legislators have the highest level of representation in part-time legislatures (RR=0.68) and lower levels of representation in full-time (RR=0.45) and hybrid (RR=0.67) legislatures.
-
Generation Z and Greatest Generation legislators represent an extremely small share of the available data; as a result, these two groups have been excluded from this analysis.
Educational Attainment
Legislators with graduate or professional degrees are overrepresented in state legislatures by over 200%, while legislators with less than a bachelor’s degree are severely underrepresented in every state legislature.
-
Legislators with less than a bachelor’s degree represent just 2.6% of state legislators and have an average representation ratio of 0.04 nationally. Legislators with less than a bachelor’s degree are severely underrepresented across full-time (RR=0.03), hybrid (RR=0.04), and part-time (RR=0.04) legislatures, and are underrepresented in every state.
-
Legislators with a bachelor’s degree represent 29.3% of state legislators and have an average representation ratio of 1.51 nationally. Legislators with a bachelor’s degree are overrepresented across full-time (RR=1.51), hybrid (RR=1.53), and part-time (RR=1.42) legislatures, and are overrepresented in all but four states (New Hampshire, New Jersey, South Dakota, and Utah).
-
Legislators with a graduate or professional degree represent 38.3% of state legislators and have an average representation ratio of 3.21 nationally. Legislators with a graduate or professional degree have some of the highest levels of overrepresentation of any demographic group across full-time (RR=3.06), hybrid (RR=3.53), and part-time (2.74) legislatures.
National, Full-Time, Hybrid, and Part-Time Averages
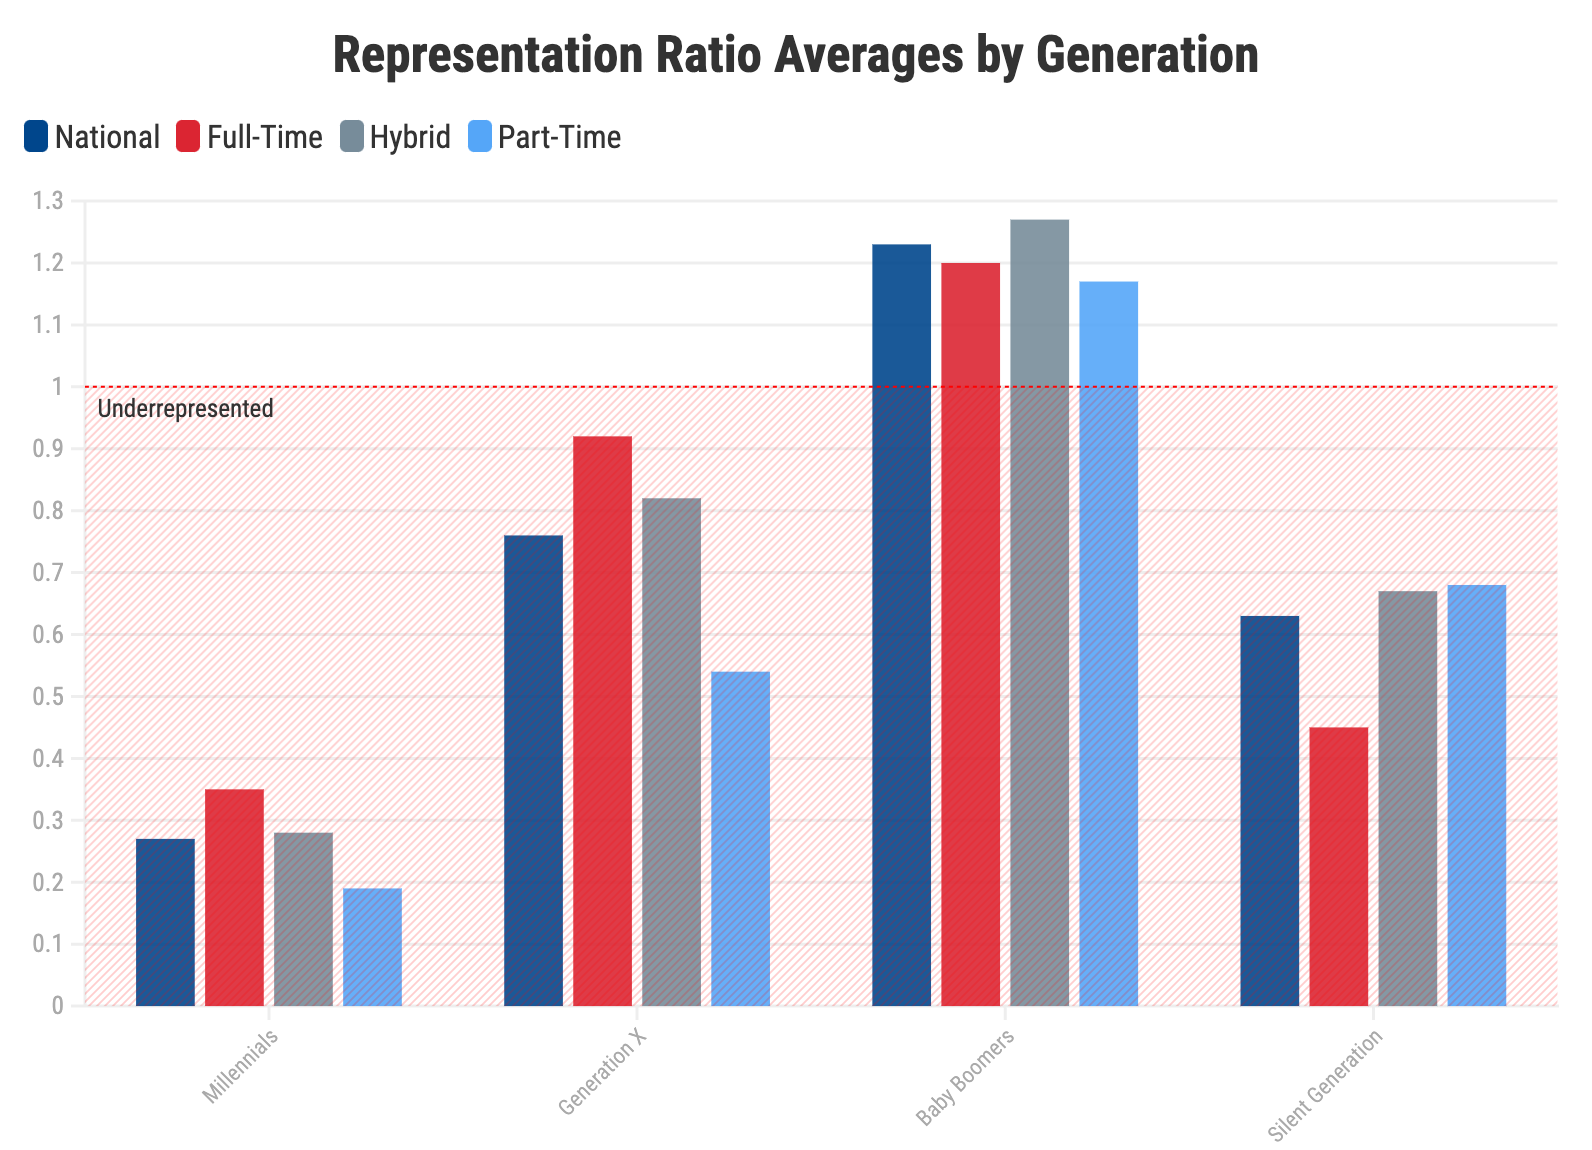
Table 1. Representation Ratio Averages: National, Full-Time, Hybrid, and Part-Time Legislatures
| Demographic Group | Number of State Legislators | % of All State Legislators | Average Representation Ratio | |||
| National | Full Time | Hybrid | Part Time | |||
| Race and Ethnicity | ||||||
| American Indian/Alaska Native | 52 | 0.70% | 0.75 | 1.05 | 0.61 | 0.79 |
| Asian/Pacific Islander | 113 | 1.50% | 0.2 | 0.39 | 0.14 | 0.16 |
| Black | 701 | 9.50% | 0.83 | 0.97 | 0.79 | 0.82 |
| Hispanic/Latino | 327 | 4.40% | 0.34 | 0.53 | 0.31 | 0.26 |
| Multiracial/Other | 65 | 0.90% | 0.5 | 1.11 | 0.4 | 0.27 |
| White | 5,863 | 79.40% | 1.14 | 1.15 | 1.17 | 1.06 |
| No Data | 281 | 3.80% | - | - | - | - |
| Women by Race and Ethnicity | ||||||
| All Women | 2,295 | 31.10% | 0.62 | 0.65 | 0.61 | 0.6 |
| Women in Leadership Positions | 88 | 25.10% | 0.48 | 0.56 | 0.5 | 0.4 |
| Asian American/Pacific Islander | 75 | 1.00% | 0.36 | 0.45 | 0.32 | 0.39 |
| Black | 366 | 5.00% | 0.99 | 0.97 | 1.02 | 0.93 |
| Latina | 153 | 2.10% | 0.3 | 0.42 | 0.28 | 0.24 |
| Middle Eastern/North African | 11 | 0.10% | * | * | * | * |
| Native American/American Indian/Native Hawaiian | 32 | 0.40% | 0.51 | 0.02 | 0.52 | 0.83 |
| White | 1,682 | 22.80% | 0.65 | 0.71 | 0.63 | 0.61 |
| Gender Identity/Expression and Sexual Orientation | ||||||
| LGBTQ+ | 200 | 2.70% | 0.63 | 0.53 | 0.64 | 0.67 |
| New Americans (first- or second-generation immigrants) | ||||||
| New Americans | 257 | 3.50% | 0.47 | 0.7 | 0.49 | 0.26 |
| Generation | ||||||
| Generation Z (1998-Present) | 3 | 0.00% | 0 | 0.01 | 0 | 0 |
| Millennials (1987-1997) | 404 | 5.50% | 0.27 | 0.35 | 0.28 | 0.19 |
| Generation X (1965-1980) | 1,098 | 14.90% | 0.76 | 0.92 | 0.82 | 0.54 |
| Baby Boomers (1946-1964) | 1,955 | 26.50% | 1.23 | 1.2 | 1.27 | 1.17 |
| Silent Generation (1929-1945) | 341 | 4.60% | 0.63 | 0.45 | 0.67 | 0.68 |
| Greatest Generation (before 1928) | 9 | 0.10% | 0.63 | 0.45 | 0.67 | 0.68 |
| No Data | 3,569 | 48.30% | - | - | - | - |
| Educational Attainment | ||||||
| Less than Bachelor’s Degree | 191 | 2.60% | 0.04 | 0.03 | 0.04 | 0.04 |
| Bachelor’s Degree | 2,166 | 29.30% | 1.51 | 1.6 | 1.53 | 1.42 |
| Graduate or Professional Degree | 2,830 | 38.30% | 3.21 | 3.06 | 3.53 | 2.74 |
| No Data | 2,202 | 29.80% | - | - | - | - |
Sources: National Conference of State Legislatures, Center for American Women and Politics, New American Leaders, Victory Institute. See our methodology appendix for a full list of sources and calculation methods.
Percentages for all are based on a denominator of 7,383, except for women in leadership positions. The percentage of women in leadership positions is calculated out of 350 total leadership positions.
*State population comparator data was not available for Middle Eastern/North African women.
State-by-State Data
Other Considerations
The scope of this publication is limited by the availability of legislator demographic data for all 50 state legislatures. Although additional data is unavailable, existing research provides some insight into other groups and communities whose members face significant barriers to serving as state legislators.
Socioeconomic status. While multiple reports have highlighted that the majority of Congress is made up of millionaires, this also holds true at the state level. This should not be a surprise, since about half of the members of Congress formerly served as state legislators. While 50-state data is not available, we can see from local reporting that millionaires make up a disproportionate share of legislators in Florida. Although an estimated 6% of Florida households are millionaires, a whopping 68% of Florida state senators and 36% of state representatives were millionaires in 2019. This Florida Legislature was largely made up of attorneys (24%); finance, insurance, and real estate executives (16%); and business owners (19%).
Disability. In 2019, researchers estimated that only 6.9% of state elected officials had a disability, although it is estimated that one in four adults have a disability. The National Council on Independent Living Disabled has created a database of political candidates with disabilities, identifying just 15 disabled candidates for state legislature who won their elections in 2020. Disabled people face multiple and compounding barriers to political participation and economic security that necessarily make running for and serving in a state legislature even more difficult. For example, disabled people who rely on already-meager Social Security benefits are subject to outdated and punishing income and asset tests that leave disabled people in financial precarity when employment income – even a modest and part-time legislator salary – can result in a loss of benefits.
Parents and caregivers. Although 86% of American women are mothers by the age of 44, mothers with school-aged children make up only 6% of Congress. Without fair pay and adequate access to child care, paid leave, health care benefits, lactation rooms, and other workplace accommodations, the long and unpredictable hours that are required of campaigning for and serving in elected office intensifies the many barriers that parents and caregivers already experience in the workplace.